
Run Slow Moving Inventory Analysis in 2–3 Days With ERP and AddBack

Slow moving inventory analysis combines three signals: how long a unit has sat since it last sold, how its turnover rate is trending, and how much cash it's tying up. The fastest path to a fix is running an aging report today, sorting by value, and flagging your top SKUs by dollars at risk. Everything else in this guide builds on that one move.
TL;DR:
- Investigate SKUs with aging buckets over 90 days, especially those with high dollar exposure and decreasing turnover trends across multiple periods.
- Focus on high-value items in the 91+ day bucket with no recent receipts, as they are most likely slow movers needing prompt action.
- Use combined metrics like inventory turnover, days inventory outstanding, and GMROII to accurately identify true slow-moving inventory.
- Prioritize review and disposition actions for SKUs in the 181–365 day range, and involve finance early for write-downs on 365+ day inventory.
- Automate data normalization and anomaly detection to accelerate inventory analysis and prevent data errors from skewing results.
Table of Contents
- What counts as slow moving inventory (and what doesn't)
- Core metrics and reports: the numbers that actually tell you something
- How do you run a slow-moving inventory analysis step by step?
- FSN, ABC-XYZ, and turning classification into action
- Reading the signals: what's actually causing the slowdown
- What to do with slow-moving inventory once you've found it
- Building a monitoring routine that keeps stock from piling up again
- Where automation actually changes the outcome
- The overlooked part of slow-moving inventory analysis
- Turn this analysis into faster deal decisions with AddBack
- Where to go deeper on the formulas and frameworks
- Sources
What counts as slow moving inventory (and what doesn't)
Not every item sitting on a shelf is a problem. A slow mover is stock that's still sellable but turning far below its category norm, usually because demand cooled or a purchasing decision overshot. Dead stock is different: it has no realistic sales path left and belongs in a write-down conversation, not a promotion calendar. Then there's strategic slow stock, held on purpose, like service parts for equipment still under warranty or safety stock for a volatile supplier. Lumping all three together is how teams end up liquidating parts they'll need next quarter or, worse, carrying dead stock for another year because nobody separated it from the merely slow.
Industry shorthand often flags anything with inventory coverage above 12 months or a turnover frequency below 1 as a suspect slow mover. That's a reasonable starting filter, but it needs tuning by category. A 12-month threshold is generous for perishables and far too loose for fast fashion, where 90 days can already mean trouble.
This is also where aging and days-on-hand split roles. Aging looks backward, measuring how long units have already sat without movement. Days-on-hand looks forward, estimating how long current stock will last given current demand. Run both. A SKU can have low days-on-hand today, because a promotion moved a few units, while its aging profile still shows a batch that's been dead weight for eight months.
Quick sorting rules that hold up in practice:
- Slow mover: still sells, but turnover has dropped below category norms for two or more consecutive periods.
- Dead stock: zero units sold in a defined window (often 180 to 365 days) with no scheduled demand.
- Strategic slow stock: intentionally held for warranty, compliance, or supply-risk reasons, and excluded from disposition scoring.
Core metrics and reports: the numbers that actually tell you something
Four metrics do most of the work: inventory turnover, days inventory outstanding, sell-through, and GMROII. Each one answers a slightly different question, and using only one gives you a distorted picture.
Inventory turnover is cost of goods sold divided by average inventory. A turnover of 4 means you cycle through your average stock four times a year. Convert that into days inventory outstanding (DIO) by dividing 365 by the turnover figure, or by computing (average inventory ÷ COGS) × 365. A turnover of 4 becomes roughly 91 days of inventory on hand. DIO is more intuitive for operators because it speaks in days, not ratios.
Weeks of supply (WOS) answers a narrower, more tactical question: at the current sell rate, how many weeks until this SKU runs out or, in the slow-mover context, how many weeks of "dead weight" are sitting there relative to actual demand. Sell-through rate (units sold ÷ units received, over a defined window) is the retail-favored version of the same idea and works well for seasonal or promotional goods.
GMROII (gross margin return on inventory investment) matters because turnover alone can mislead you. An item might turn respectably but generate thin margin relative to the capital tied up in it. GMROII surfaces exactly that gap, which is why it belongs in any serious prioritization model, not just a nice-to-have dashboard tile.
Pro Tip: Never trust a single snapshot of turnover. A downward trend across three or four periods is a far stronger signal than one bad month, and it often shows up before the aging report does.
The inventory aging report is the backbone document. It assigns every on-hand unit to a bucket based on days since last demand, then shows quantity and value per bucket.
| Aging bucket | Typical action trigger |
|---|---|
| 0–30 days | Normal, no action |
| 31–60 days | Watch list, no intervention yet |
| 61–90 days | Monitor closely, review reorder rules |
| 91–180 days | Pause purchasing, begin markdown planning |
| 181–365 days | Plan disposition, start supplier or transfer conversations |
| 365+ days | Open write-down conversation with finance |
Those action thresholds aren't arbitrary. They map to the point where carrying cost starts outpacing any realistic recovery value, and they're the same boundaries most ERP systems use out of the box.
The real skill is triangulation. High DIO plus aging concentrated in the 91+ bucket plus no receipts in the last two quarters is a near-certain slow mover. High DIO alone, on a SKU with a recent large receipt, might just mean you overbought last month, not that demand collapsed.
How do you run a slow-moving inventory analysis step by step?
A repeatable workflow turns this from a one-off spreadsheet exercise into something your team can run monthly without reinventing the process each time.
- Pull the data. You need on-hand quantity, last-sold date, receipt history, unit cost or COGS, location, vendor, and lead time per SKU. Missing any one of these fields creates blind spots, especially last-sold date, which most systems log inconsistently across channels.
- Validate before you calculate. Reconcile negative balances, strip out phantom receipts (common after system migrations or cycle count corrections), and confirm that "last sold" reflects actual demand, not a return or an internal transfer that got miscoded as a sale.
- Build the aging buckets. Use 0–30, 31–60, 61–90, 91–180, 181–365, and 365+ as your starting structure, then adjust boundaries by category if perishables or fashion goods need tighter windows.
- Cohort the data. Group SKUs by category, vendor, and channel before you draw conclusions. A vendor-wide slowdown looks very different from an isolated SKU problem, and cohorting is what separates the two.
- Score each SKU. Combine three inputs into a single slow-mover index: age bucket, turnover trend direction, and dollar value exposure. A simple weighted sum works fine; you don't need a machine learning model to rank 2,000 SKUs.
- Prioritize by value at risk. Apply a Pareto cut. In most datasets, a small share of SKUs disproportionately drives the dollars sitting in the worst buckets. Focus your first pass entirely there.
- Assign owners and deadlines. Every SKU on the priority list gets a named owner (purchasing, sales, or ops) and a decision date, not an open-ended "monitor" status.
Pro Tip: Run the guided cycle count before you trust the number. Cleverence recommends triggering a physical count whenever a SKU enters the 90+ day bucket, because a surprising share of "slow movers" turn out to be data errors, not real demand problems.
The whole sequence, done in a spreadsheet with a clean ERP export, typically takes a small team two to three days for a first pass and considerably less on repeat runs once the cleansing rules are automated.
FSN, ABC-XYZ, and turning classification into action
Fast, Slow, and Non-moving (FSN) classification sorts SKUs by movement speed alone, which makes it a fast first filter but a blunt one. ABC-XYZ adds the dimension FSN is missing: value and demand variability. ABC ranks by revenue or margin contribution (A items typically drive most of the value from a minority of SKUs), while XYZ ranks by how erratic demand is (X is steady, Z is wildly variable).
The combination matters because the most dangerous slow movers hide in the BZ and CZ corners: low-to-mid value items with unpredictable demand. They rarely trigger alarm on a pure value-ranked report, yet they accumulate in aging buckets quietly because nobody's watching them closely.
- AZ or AY items in the 91+ bucket: high priority, involve sales and purchasing immediately, since the dollar exposure is large.
- BZ or CZ items in the 91+ bucket: batch review monthly rather than individually, but don't ignore them, since they compound over time.
- CX items with low turnover: often safe to leave alone if margin is acceptable and carrying cost is trivial.
- Any class in the 365+ bucket: escalate to finance regardless of ABC tier, because the write-down conversation applies across the board.
A tiered threshold by ABC class beats a single universal cutoff, because a 90-day gate is too aggressive for a low-value C item and too lenient for a capital-intensive A item. Set tighter aging tolerances for A items and looser ones for C items, then let the scoring index do the rest.
Reading the signals: what's actually causing the slowdown
An aging report tells you that something's stuck. It doesn't tell you why, and treating every slow mover with the same remedy is how good inventory gets discounted away for no reason while genuinely dead stock lingers untouched.
- Demand-driven causes: a steady sales decline, a shift to a different channel (in-store to online, direct to marketplace), or cannibalization from a newer product replacing the old one.
- Supply and process causes: a supplier raised minimum order quantities, lead times stretched and forced overbuying as a buffer, or an engineering change made the current batch a legacy version.
- Data-quality causes: phantom receipts inflating on-hand counts, mislabeled or duplicate SKUs splitting sales history across two records, or a "last sold" field that's actually logging returns.
The fastest way to isolate the real cause is a cohort comparison. If every SKU from one vendor is aging simultaneously, that's a supply-side signal. If one SKU is aging while its direct category peers are turning normally, look at cannibalization or a data error first. And if the last-sold cadence shows regular small sales suddenly stopping on a specific date, check for a system change or a channel migration around that date before assuming demand died.
What to do with slow-moving inventory once you've found it
The right remedy depends on where the SKU sits in its aging bucket and how much value it's holding, not on a blanket policy of "discount everything."
- Recovery, for items still in the 91–180 range. A markdown ladder (10%, then 25%, then 40% at set intervals) recovers more margin than one deep discount up front. Bundling slow movers with fast sellers or running targeted promotions to a specific customer segment also works better than a storewide sale.
- Reposition, when the item still has demand somewhere else. Inter-location transfers move stock to a branch or region where it sells at full price. Re-bundling or repackaging can reposition an item as part of a kit rather than a standalone SKU that's clearly aging.
- Supplier and contractual options, for items still under vendor terms. Some agreements allow returns or exchanges for slow-moving stock. Renegotiated minimum order quantities on future purchases prevent the same buildup from repeating.
- Aggressive disposition, for the 181–365 and 365+ buckets. Liquidation through a secondary channel, donation for a tax benefit, or scrapping are the last resort, and finance should be looped in before any write-down hits the books.
- Operational prevention, so the cycle doesn't repeat. Tighten reorder rules for chronic offenders, tune safety stock downward for SKUs with proven demand volatility, or shift borderline items to a make-to-order model entirely.
Pro Tip: Don't wait for the 365+ bucket to loop in finance. Getting them involved at the 181-day mark, while there's still some recovery value on the table, produces far better outcomes than a year-end scramble to write off a pallet nobody remembers ordering.
Building a monitoring routine that keeps stock from piling up again
A one-time cleanup fixes today's problem. A cadence prevents tomorrow's. Most teams that get this right run three overlapping loops: a weekly rapid check on newly aging SKUs, a monthly deep review of the full aging report by cohort, and a quarterly rationalization pass that revisits classification and reorder rules.
- Track the percentage of total inventory value sitting in the 90+ day buckets, and treat any upward trend as an early warning, not a lagging metric.
- Watch turns by cohort (vendor, category, channel) rather than only company-wide turns, since an aggregate number can hide a rotting pocket.
- Monitor GMROII trend alongside turnover, since a SKU can turn acceptably while margin quietly erodes.
- Report cash released from disposition actions back to finance every quarter, tying the analysis directly to working capital rather than treating it as an operations-only exercise.
Set alert rules tied to the aging thresholds themselves: an automatic flag when a SKU crosses into the 91-day bucket, and a mandatory cycle count when it crosses into 181 days. Continuous, automated monitoring closes the gap between periodic reviews and catches items before they slide from slow to dead between your monthly meetings. Assign SLA-style ownership: purchasing owns the 30 to 90 day watch list, category managers own the 91 to 180 day markdown decisions, and finance signs off on anything crossing into write-down territory.
Where automation actually changes the outcome
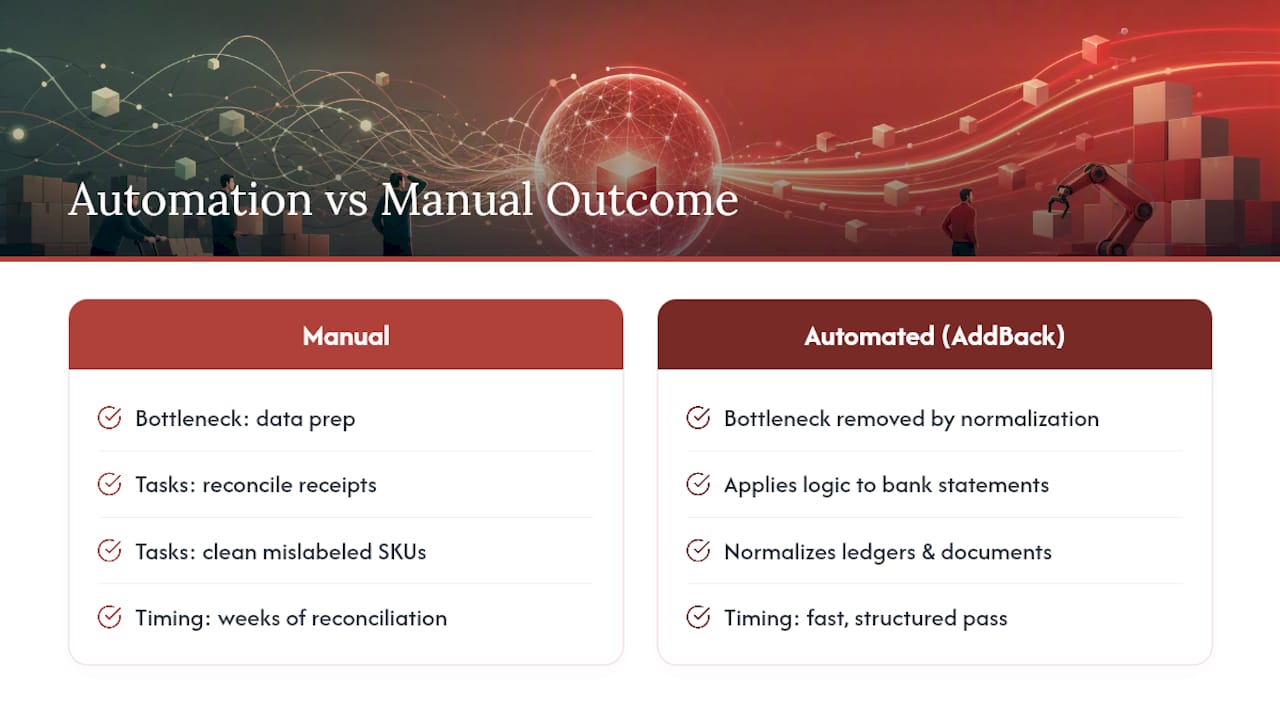
Manual aging analysis breaks down at scale mostly because of data prep, not math. Reconciling receipts, cleaning up mislabeled SKUs, and normalizing figures across systems eats most of the time a slow-mover review actually takes. This is the exact bottleneck automated financial data tools are built to remove: AddBack's approach to automated data normalization applies the same logic to bank statements, ledgers, and financial documents that a good inventory system applies to aging buckets, turning weeks of manual reconciliation into a fast, structured pass.
Anomaly detection follows the same principle. Instead of waiting for a quarterly review to notice a phantom receipt or an unusual consumption spike, automated flagging surfaces the irregularity as soon as it appears in the data, well before it distorts a turnover calculation or hides in a stale aging bucket. The same discipline that makes AI-driven diligence faster than sampling-based review applies directly to catching inventory data errors before they cost you a bad disposition decision.
The overlooked part of slow-moving inventory analysis
Most guides treat this as a math problem: run the formula, sort the bucket, discount the SKU. The math is the easy part. What actually determines whether a slow-mover program works is whether someone owns the decision once the report is generated, and most programs die right there, in the gap between "we identified the problem" and "someone acted on it within the week."

The conventional advice to "review inventory quarterly" is too slow for anything with real value concentration. A quarterly review cadence may allow an A-item slow mover to sit unaddressed for several months, by which point the recovery window may have closed and a write-down could be required rather than a markdown opportunity. Weekly rapid checks on high-value SKUs, paired with a monthly deep dive for everything else, are efficient approaches that catch problems while margin remains to be saved, especially with automated aging reports and scoring indices.
If there's one place to start, it's not the classification framework. It's the data. Clean, validated inputs make FSN and ABC-XYZ trivial to apply. Dirty data makes even a perfect framework produce garbage rankings, which is exactly why the reconciliation step deserves more attention than most teams give it.
— Klara
Turn this analysis into faster deal decisions with AddBack
Everything covered here about clean data feeding accurate scoring applies directly to financial due diligence, where messy bank statements and inconsistent ledgers slow down deal screening the same way phantom receipts distort an aging report. AddBack ingests and normalizes bank statements, general ledgers, contracts, and payroll data, then runs anomaly detection, working capital analysis, and margin checks, producing a unified report in about 60 minutes instead of the six weeks a traditional review takes.

A typical run supports common bank and accounting exports, flags revenue quality issues and unusual cash movements automatically, and returns candidate EBITDA adjustments alongside the anomaly findings, so you can screen out a weak deal before spending real money on a full quality-of-earnings report. If you're evaluating an acquisition or lending decision and want to see how the analysis maps to your own documents, learn how financial due diligence works with AddBack and check what a screening pass would surface for your next deal.
Where to go deeper on the formulas and frameworks
For the aging report mechanics referenced throughout this guide, Microsoft's inventory aging report documentation walks through bucket logic in an ERP context. For turnover and DIO formulas, Investopedia's inventory turnover explainer covers the calculation and trend-based interpretation in more depth. For the FSN and ABC-XYZ classification frameworks and their procurement applications, Tacto's slow-moving inventory glossary is a solid reference, and Cleverence's detection workflow guide offers practical cycle-count triggers. Teams building out broader process governance around these routines may also find value in structured project management practices for coordinating cross-department disposition efforts.
Sources
- Inventory aging report (Microsoft Dynamics 365)
- Slow-Moving Inventory Analysis: Definition, Methods, and Strategic Importance in Procurement (Tacto)
- How to identify slow moving inventory? Metrics, workflows, and examples (Cleverence)
- Inventory turnover (Investopedia)
- Inventory Aging Analysis: Identifying Dead Stock | Marquis Data